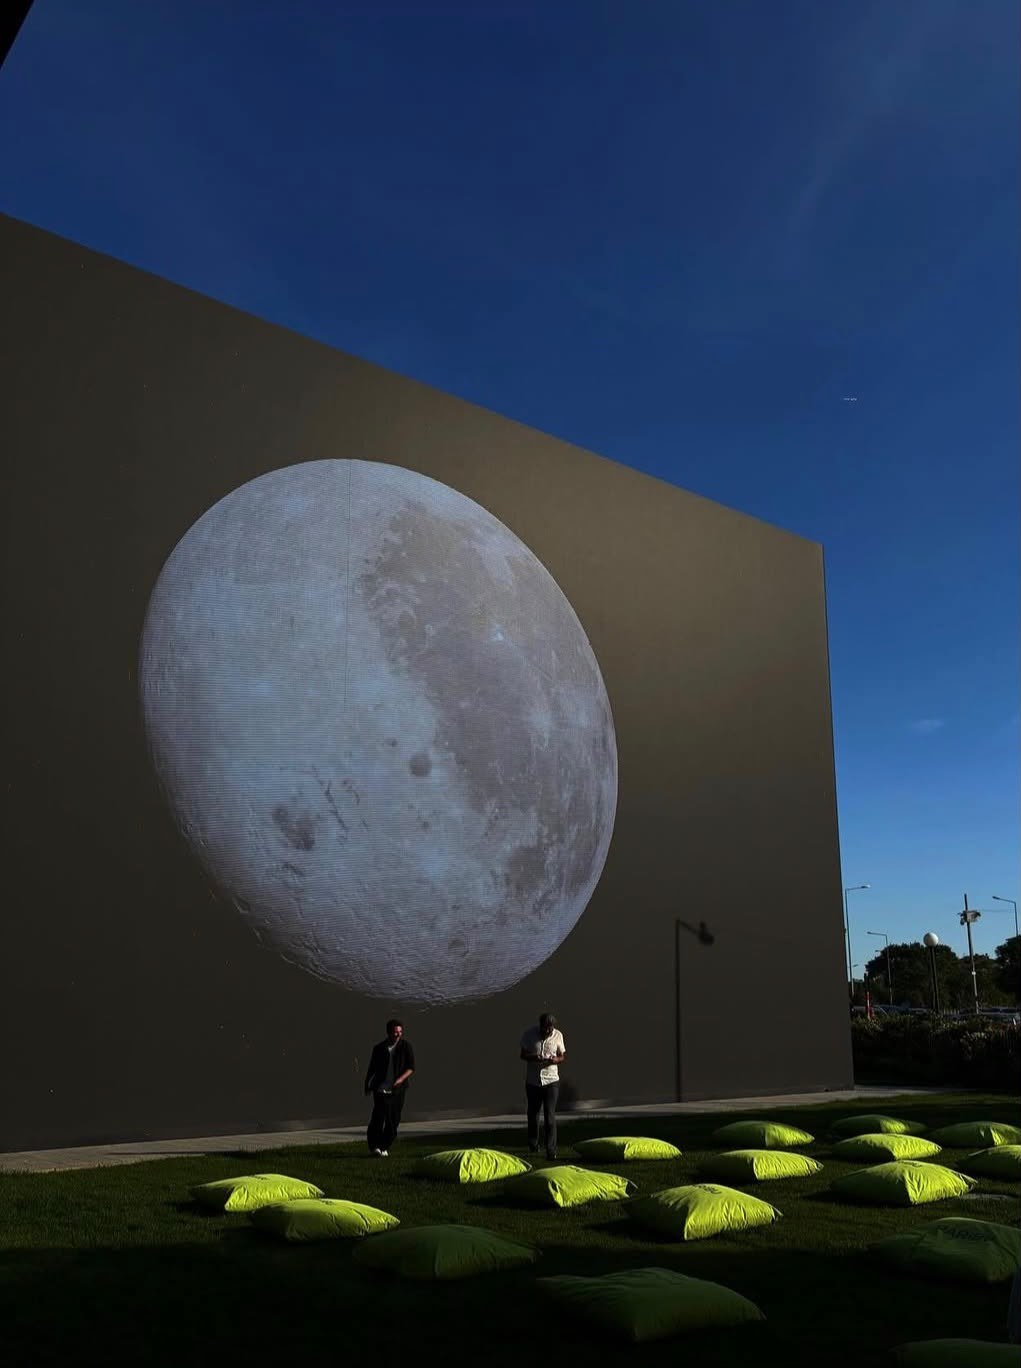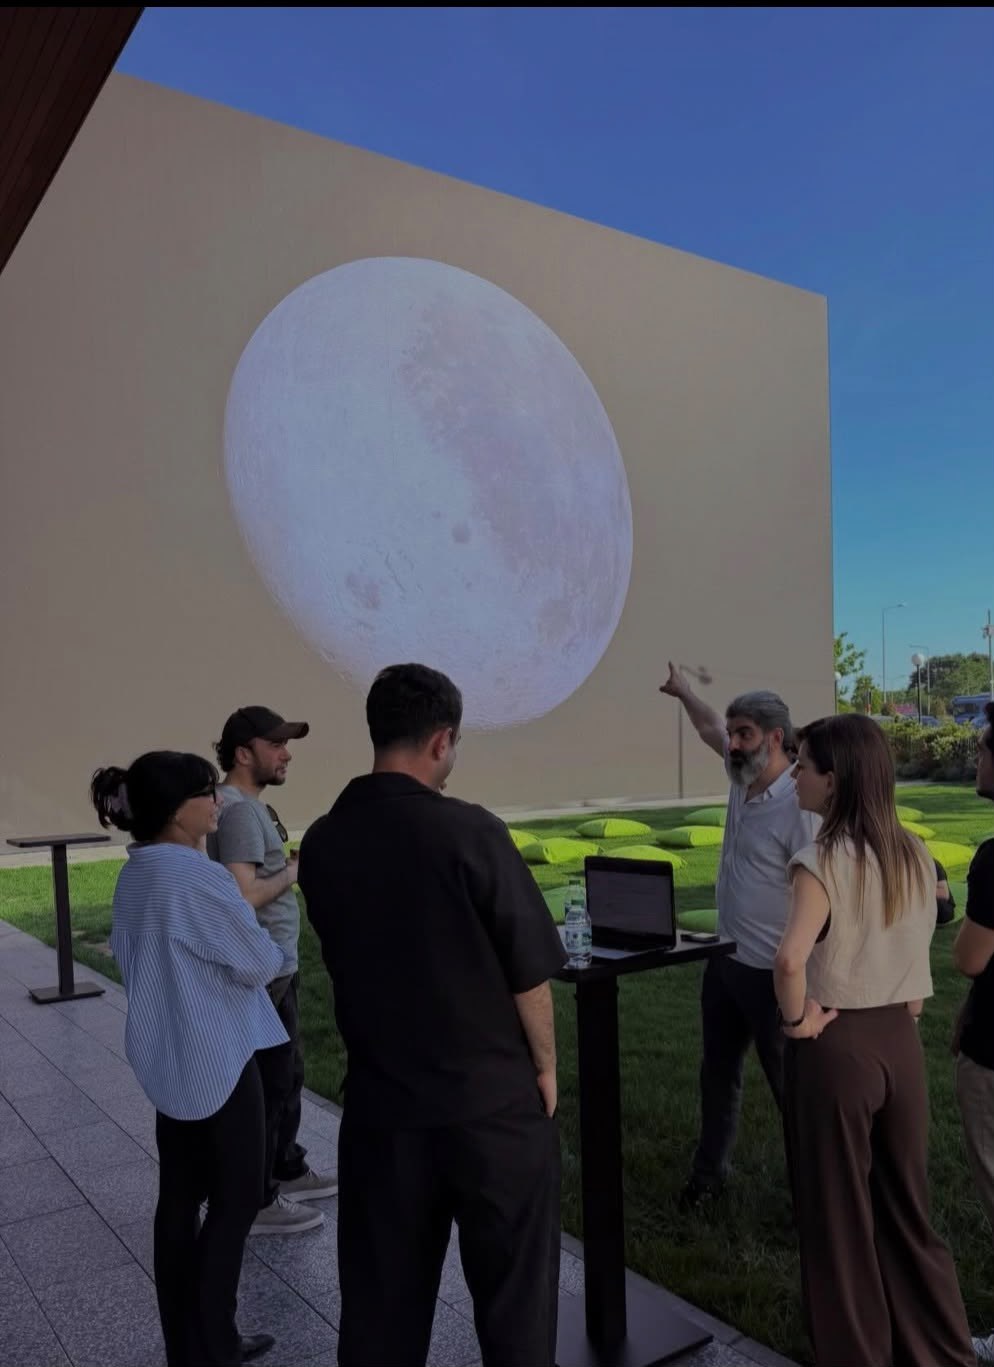
A building that watches the Moon
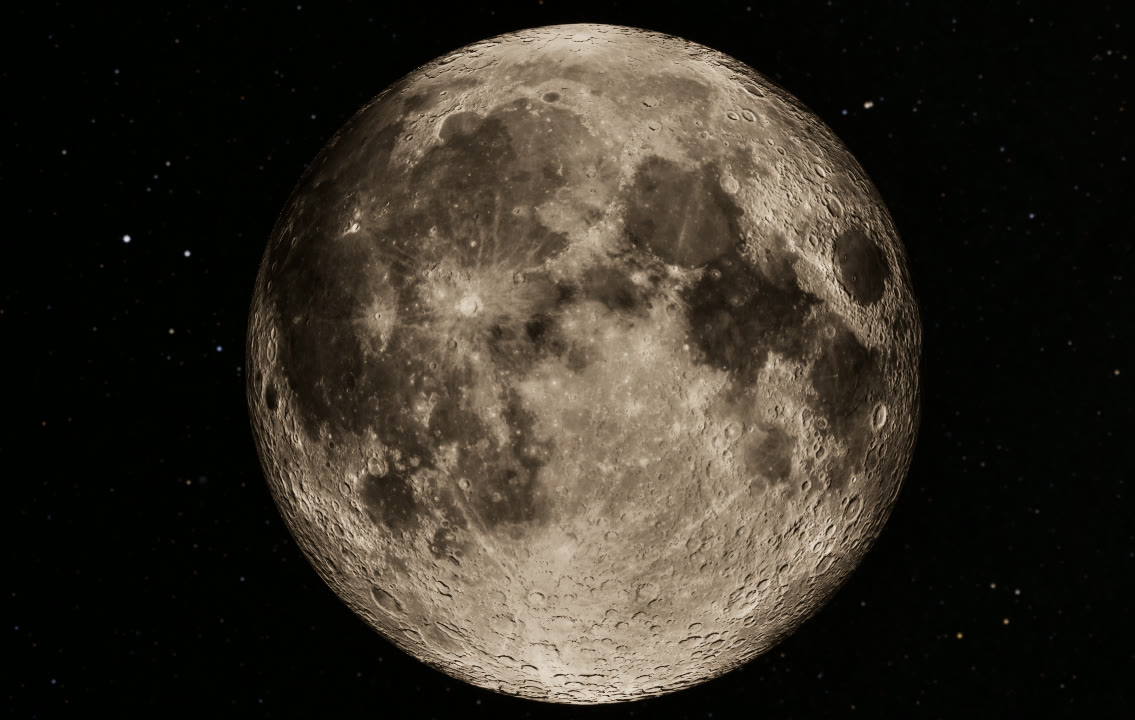
2026For Observatory, we imagined Paribu Art as a curious being that looks up at night through a virtual telescope on its roof. But if it was going to watch the Moon, it should watch the real one: where it is tonight, which phase, how far it is from Earth and how big it looks, which stars stand behind it. We turned the poetic idea into astronomy, geometry and real-time data: NASA's lunar surface data and about 120,000 stars.
Under the hood
Before we opened Unreal, we listed what the observatory had to show. Each item needed its own calculation:
- The Moon's phase at this moment: which side the crescent is on and how full it is.
- The Moon's apparent size, brightness and tidal pull, which change by the hour as it moves between its nearest and farthest points from Earth.
- The planets and constellations standing behind the Moon, seen from Paribu Art at that moment.
- The whole star map around us, with each star in the right place and the right colour.
The data
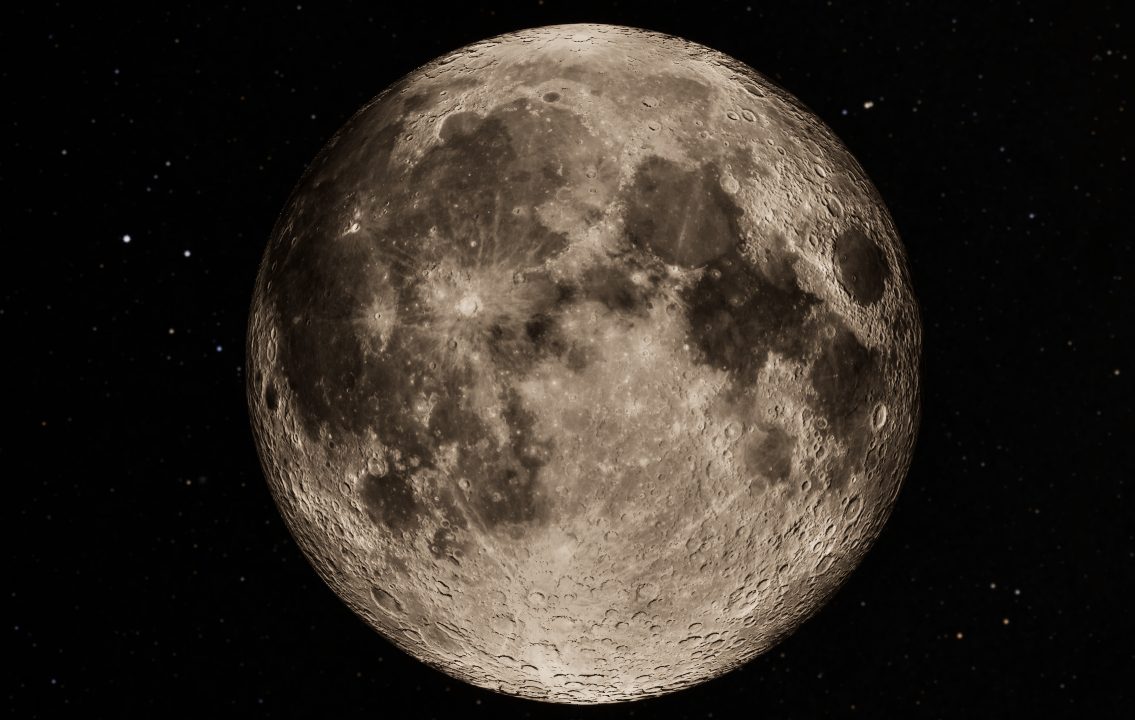
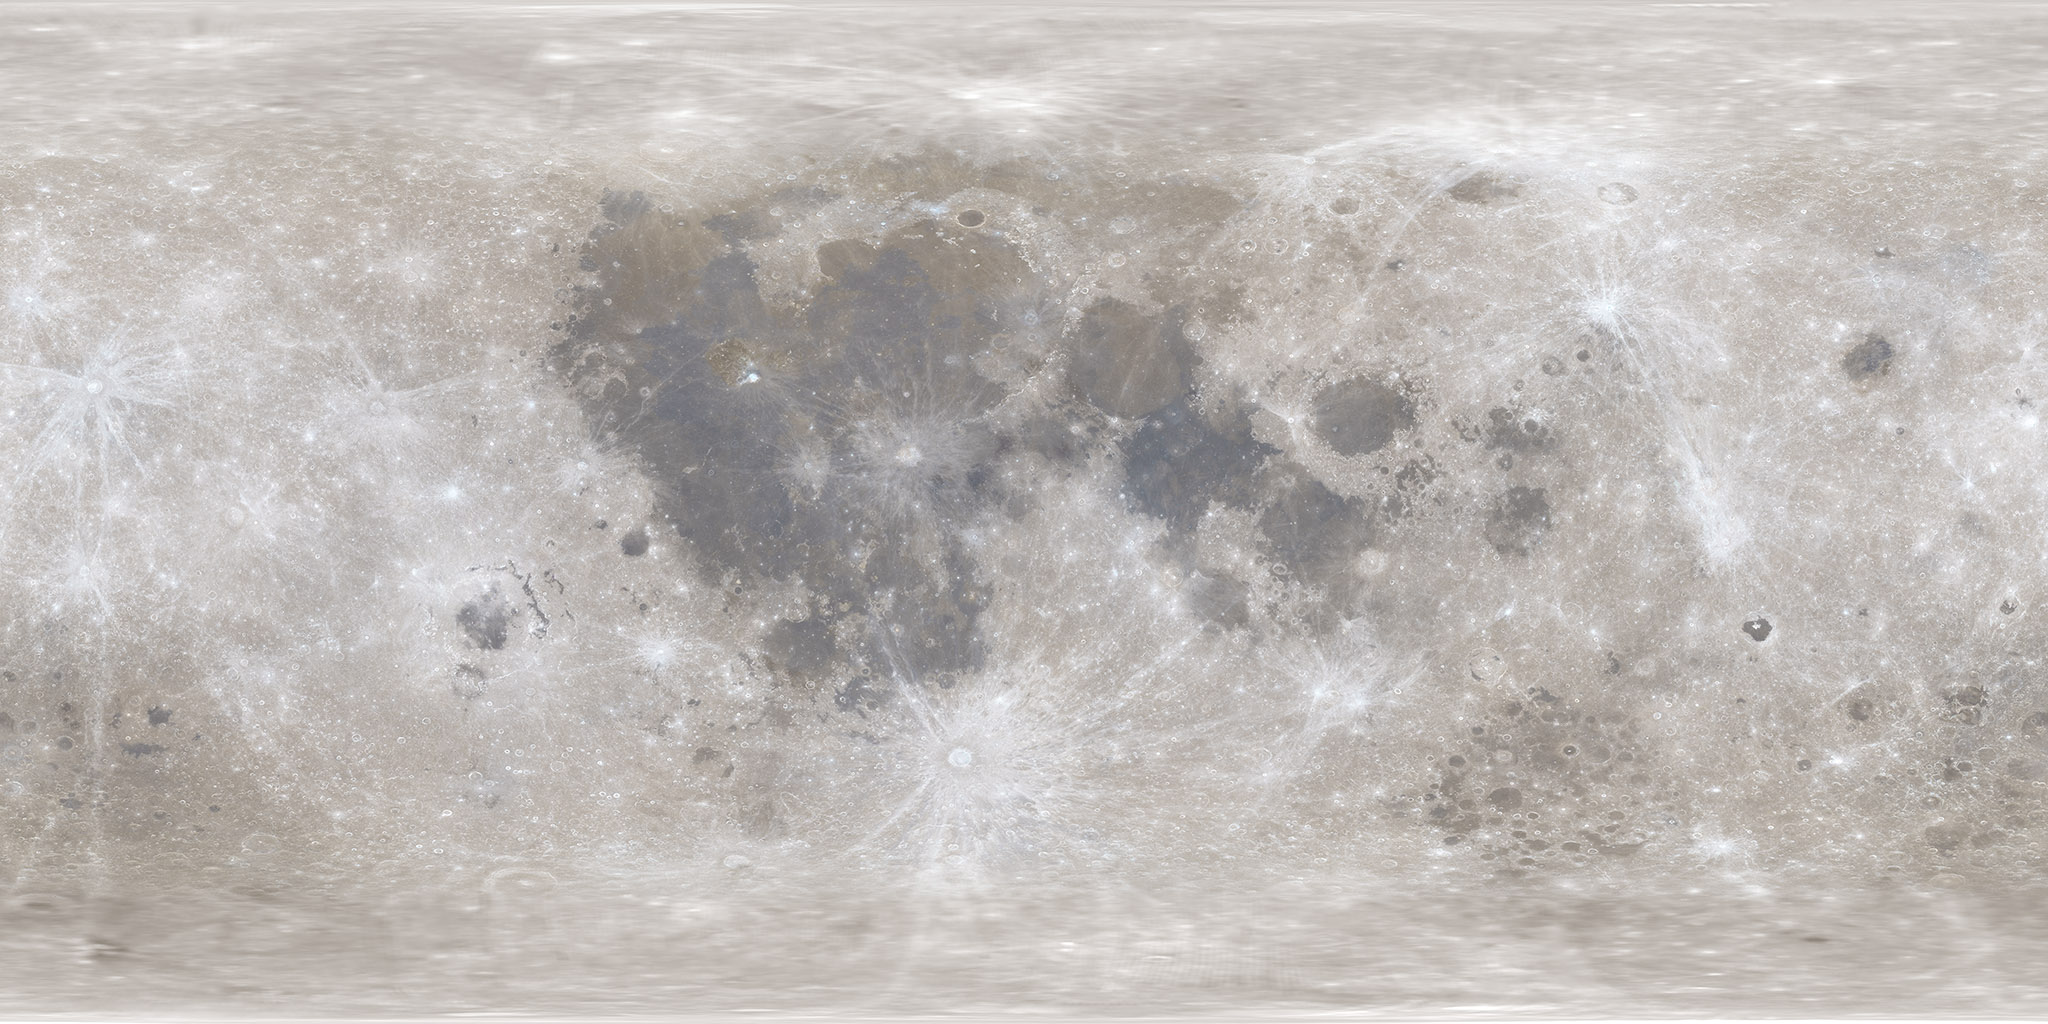
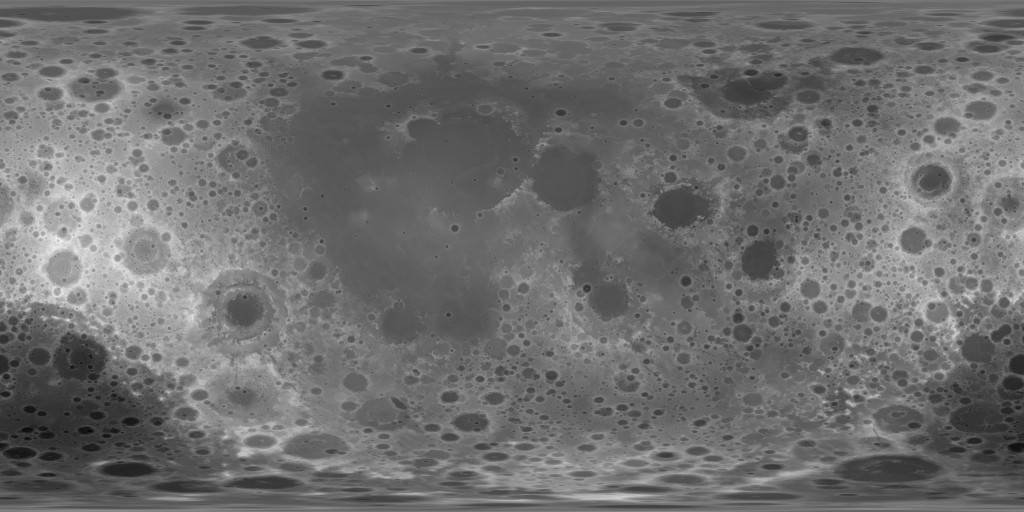
We built the Moon from NASA's CGI Moon Kit (NASA/GSFC Scientific Visualization Studio). A colour map made from LROC images gives the surface its tones and albedo; a displacement map made from LOLA laser altimeter measurements stores a height for each pixel and shapes the craters and terrain.
The stars come from the HYG 4.2 catalogue: about 120,000 stars with position, distance, brightness and B−V colour index. It merges Hipparcos (precise positions, and distances measured by parallax), the Yale Bright Star Catalogue (the stars you can see with the naked eye) and Gliese (the stars near the Sun).
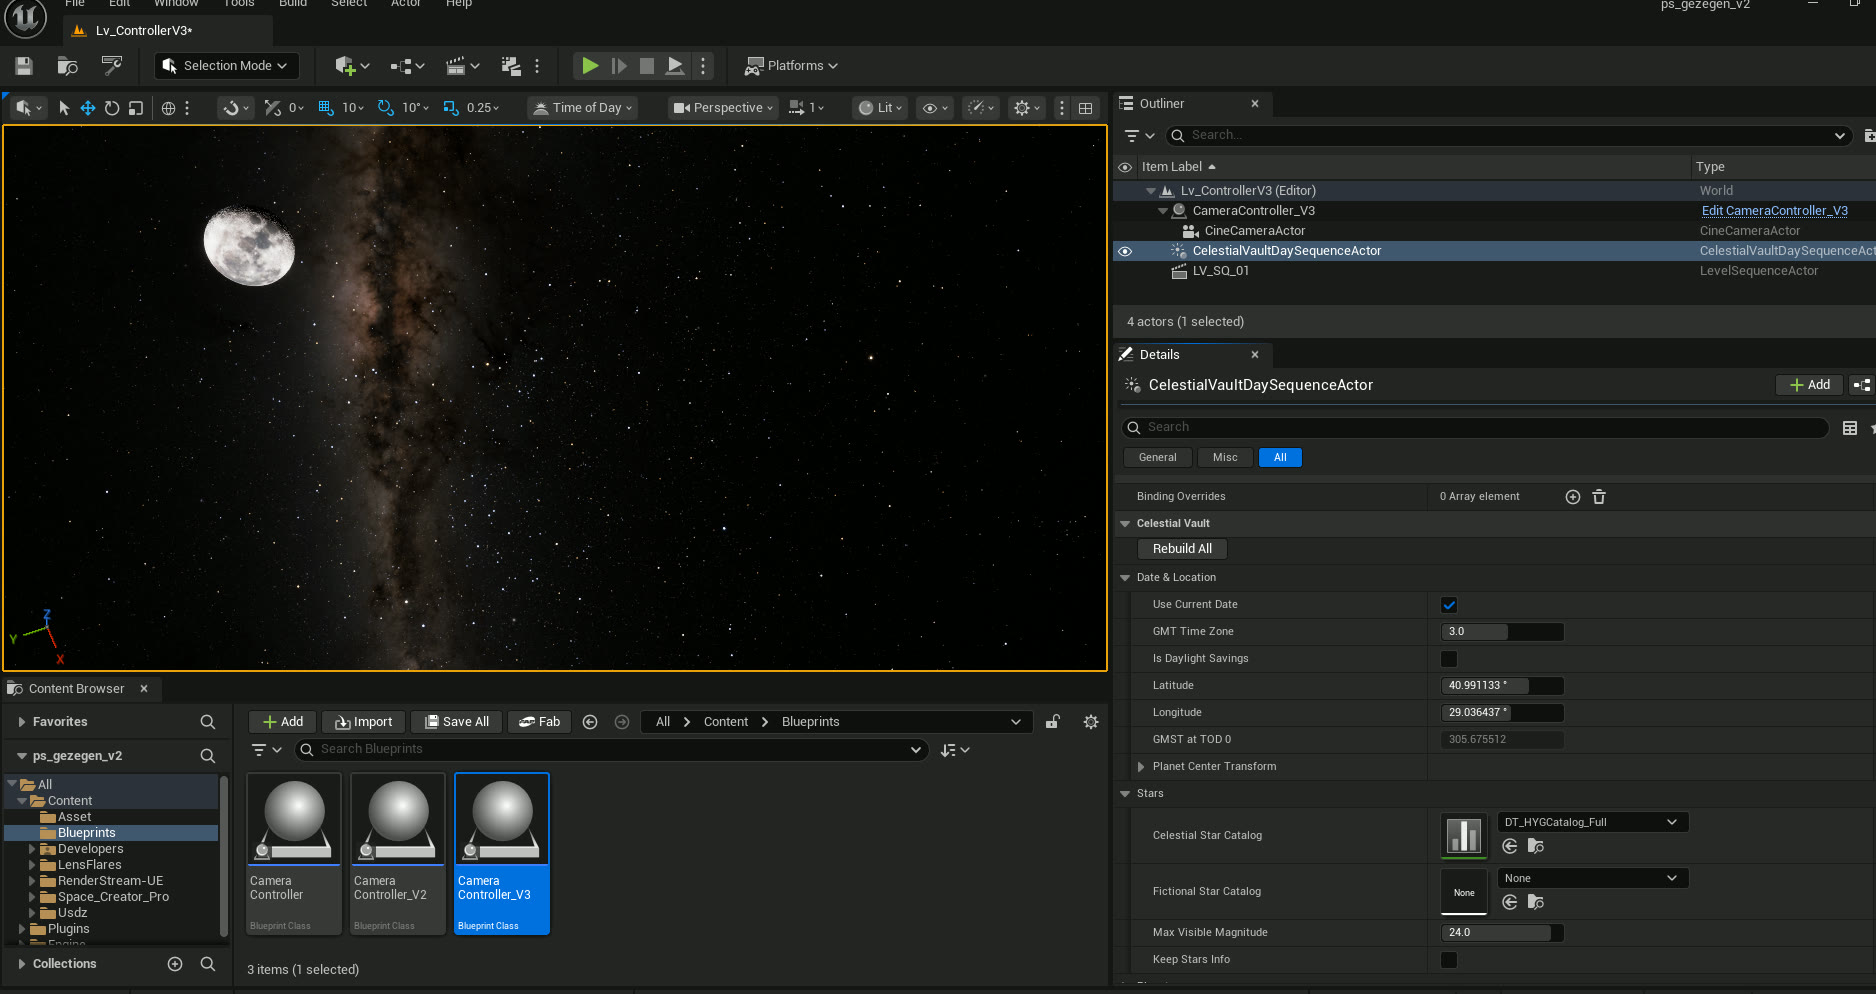
Inside Unreal we used the Celestial Vault plugin. With it we could get the positions of the Sun and the Moon for Paribu Art's coordinates.
Production log in Unreal Engine 5.6
1. Setting up the scene
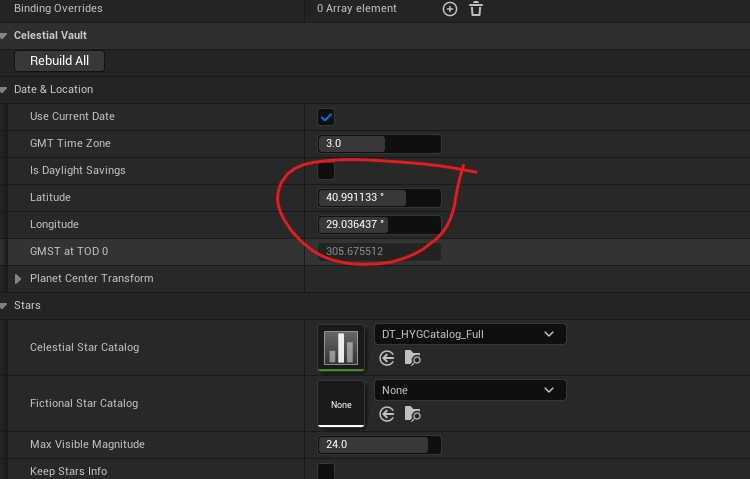
We connected Celestial Vault to Paribu Art's coordinates (40.991133° N, 29.036437° E), balanced the date, time, light and materials, and locked the camera's rotation on the Moon.

The phase needs nothing more. The Moon's light is reflected sunlight, and the phase depends only on the angle between the Sun, the Moon and Earth, so Istanbul and Tokyo see almost the same phase at the same moment. The plugin takes the phase from the date, and the viewing direction from our coordinates.
Positions and times follow the data. To make the picture readable, we sized the Moon, tuned the scene, materials and light until the craters showed, and widened the view of the star map behind it.
2. The frame kept turning
The camera followed the Moon, but over the day it rotated around its own axis and turned the star field with it.
Real telescopes have the same problem. On an alt-azimuth mount, the telescope's up is the local up: the Moon stays in the centre, but the image turns slowly. Astronomers call this field rotation. An equatorial mount tilts its polar axis by the observer's latitude, parallel to Earth's axis and aimed at the north celestial pole next to Polaris, and the image stays steady.
We moved the camera's up vector from the local up to the north celestial pole, and our virtual telescope began to behave like an equatorial mount: the Moon in the centre, the frame steady.
3. We saw the Moon from the side
As Earth turned, our camera began to see the Moon sphere from the side.
From Earth you always see the same face of the Moon: it turns on its axis in the same 27.3 days it takes to circle us, and libration, a small wobble caused by its elliptical orbit, shows only a little past the edges. Earth's radius is 6,371 km and the Moon is 384,400 km away; 6,371 / 384,400 = 0.0166, so the observer's movement can shift the view by about 0.95° at most. In our scene the observer moved much further than that compared with the Earth–Moon distance.
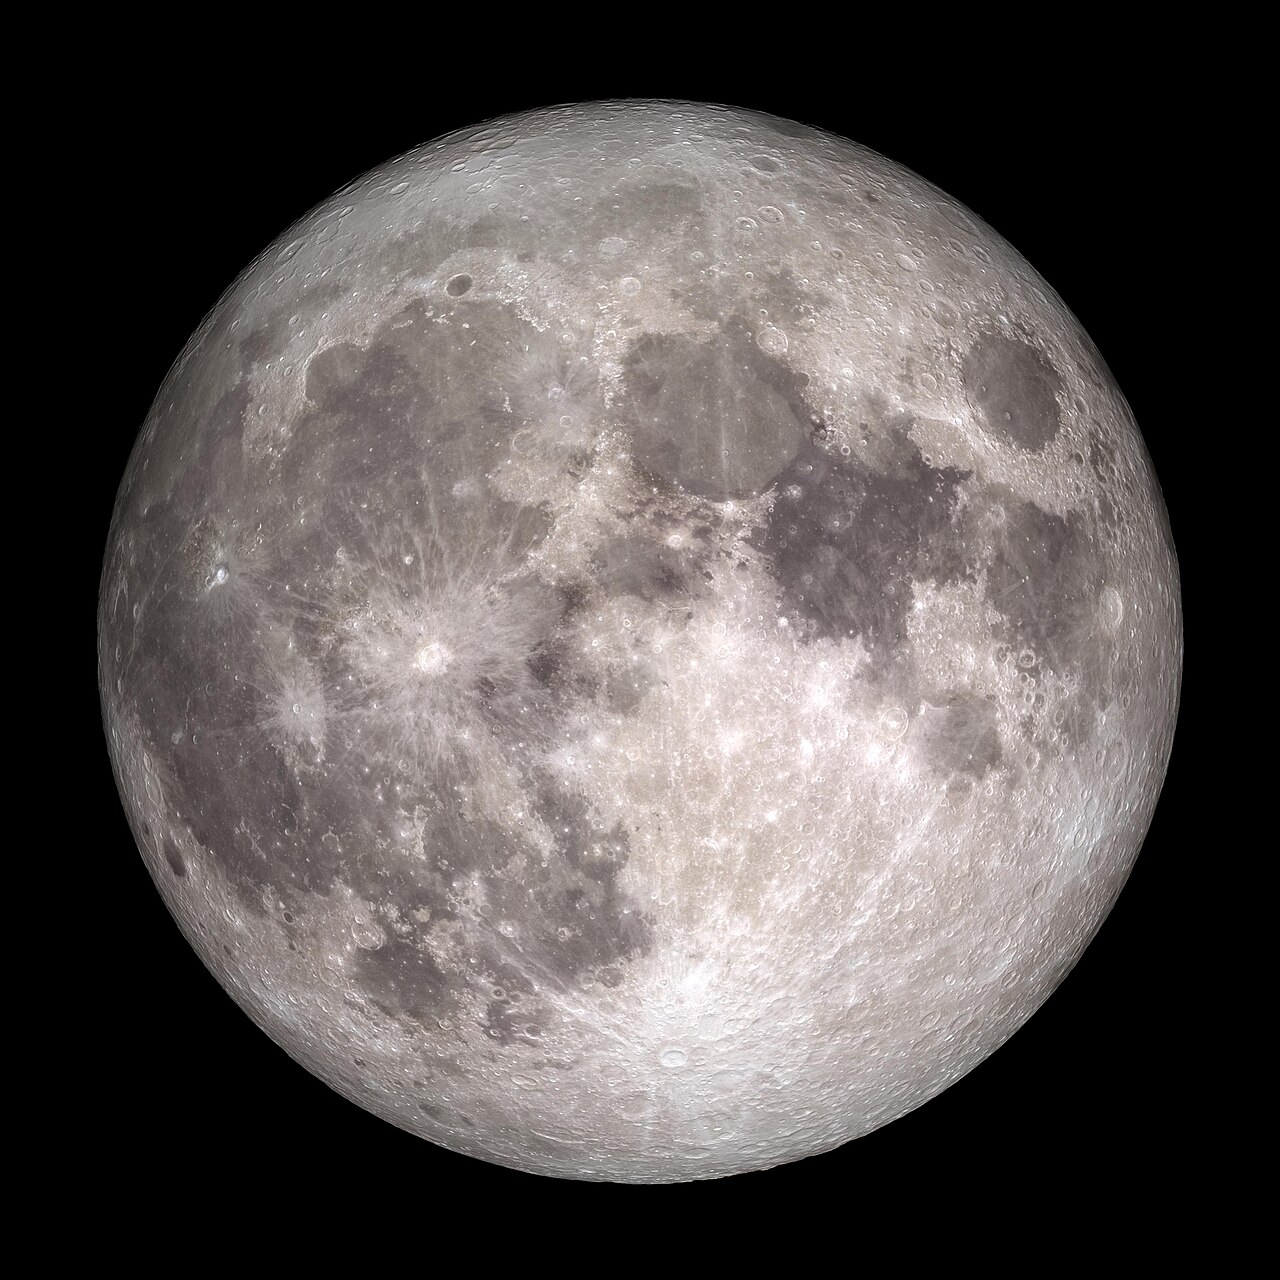
We scaled Earth's radius in proportion to the Earth–Moon distance, kept the Moon model facing the camera and rebalanced the lens angle. The parallax dropped to its natural level, and the Moon showed its familiar face again.
4. No room for the stars
At real scale the Moon filled the screen and almost no stars fit beside it. A lens wide enough for the stars made the Moon tiny.
In the sky the Moon covers only about 0.52°, and its apparent diameter changes by up to 14% between its nearest and farthest points. A telescope that frames the Moon sees a very small patch of stars around it.
We used two lenses on purpose: one for the Moon, which keeps its real phase and orientation, and a wider one for the stars behind it, which keep their real positions.
5. Which stars are behind the Moon?
In a sped-up day, the stars behind the Moon drifted along with it, and we still had to tell which constellation the Moon stood in that night.
Through one night, the Moon and its stars cross the sky together because Earth turns. From night to night, the Moon moves about 13.2° east against the stars and completes the circuit in 27.32 days.
Celestial Vault computes this motion, and the observatory matches the Moon's position on the ecliptic to the constellation boundaries to name the star field behind it.
6. The colours of the stars
We wanted each star's colour to come from measurement.
A star's colour comes from its surface temperature. Along the O–B–A–F–G–K–M sequence, hot stars look blue-white and cooler stars orange-red. The B−V colour index in the HYG catalogue holds that difference as a number: low and negative values for blue-white stars, high values for yellow, orange and red ones.
We gave each star material a colour derived from its B−V index, and calculated its brightness separately from its magnitude.
Technical credits
- Engine
- Unreal Engine 5.6, Celestial Vault (beta; planet positions from VSOP87)
- Moon surface
- NASA/GSFC Scientific Visualization Studio, CGI Moon Kit, Lunar Reconnaissance Orbiter (LROC, LOLA)
- Phase reference
- NASA Science, Moon Phases; NASA SVS, Moon Phase and Libration
- Star catalogue
- HYG 4.2 (Hipparcos, Yale Bright Star, Gliese), CC BY-SA 4.0, David Nash / Astronomy Nexus
- Observer
- Paribu Art, 40.991133° N, 29.036437° E
- Photo
- NASA Goddard / LRO (CC BY 2.0)
- Production notes
- Gözlem Evi (in Turkish)
We sum the project up as “a poetic image, a numerical backbone”, and I think that line fits all of our work.